
Introduction
Brick-and-mortar retailers need robust statistical methods and rigorous experimental design to conduct accurate A/B tests [1]. To make the problem more complex, retail data is unique in a number of ways that complicate statistical analysis. For example, retail data is hierarchically nested within customer and store data and is also collected over time. This time-series data is serially autocorrelated, meaning that individual data points are not independent over time. This reduces effective sample size and inflates confidence numbers from statistical analyses. MarketDial has developed a testing methodology for control matches that has been shown to properly account for these autocorrelations and produce reliable estimates of lift and confidence. To see a complete description of this methodology please see the white paper entitled, “MarketDial’s Scaled Control Methodology.” Here we focus on how the number of control matches used in a matching procedure impacts the accuracy of an A/B test.
1. Evaluation criteria for control matches
1.1 Rationale
In order to compare control matching methods [3], we used a series of experiments. For a given sample size (store count and test duration), we selected a random time point in a span of 3 years of historic data as the test start date, selected random treatment stores, selected control stores using the MarketDial control store selection method, and then analyzed the test to get lift results. Since no initiative has been carried out on this set of stores at this time, we expect the computed lift to be close to zero. We can evaluate any lift calculation’s accuracy by computing the variance of the simulated lift calculations around zero. The method that results in an average lift closest to zero with the smallest standard deviation is considered the most accurate method.
Alternatively we could add an artificial lift of x% by multiplying all of the post-period data for the treatment group by 1+x. We would then compare the computed test lifts against the expected value of x%. This yields nearly identical results for those seen using the simpler 0% lift comparison, thus for the remainder of the paper we will analyze the results of the null tests described above.
1.2 Experiment design & lift calculation methods
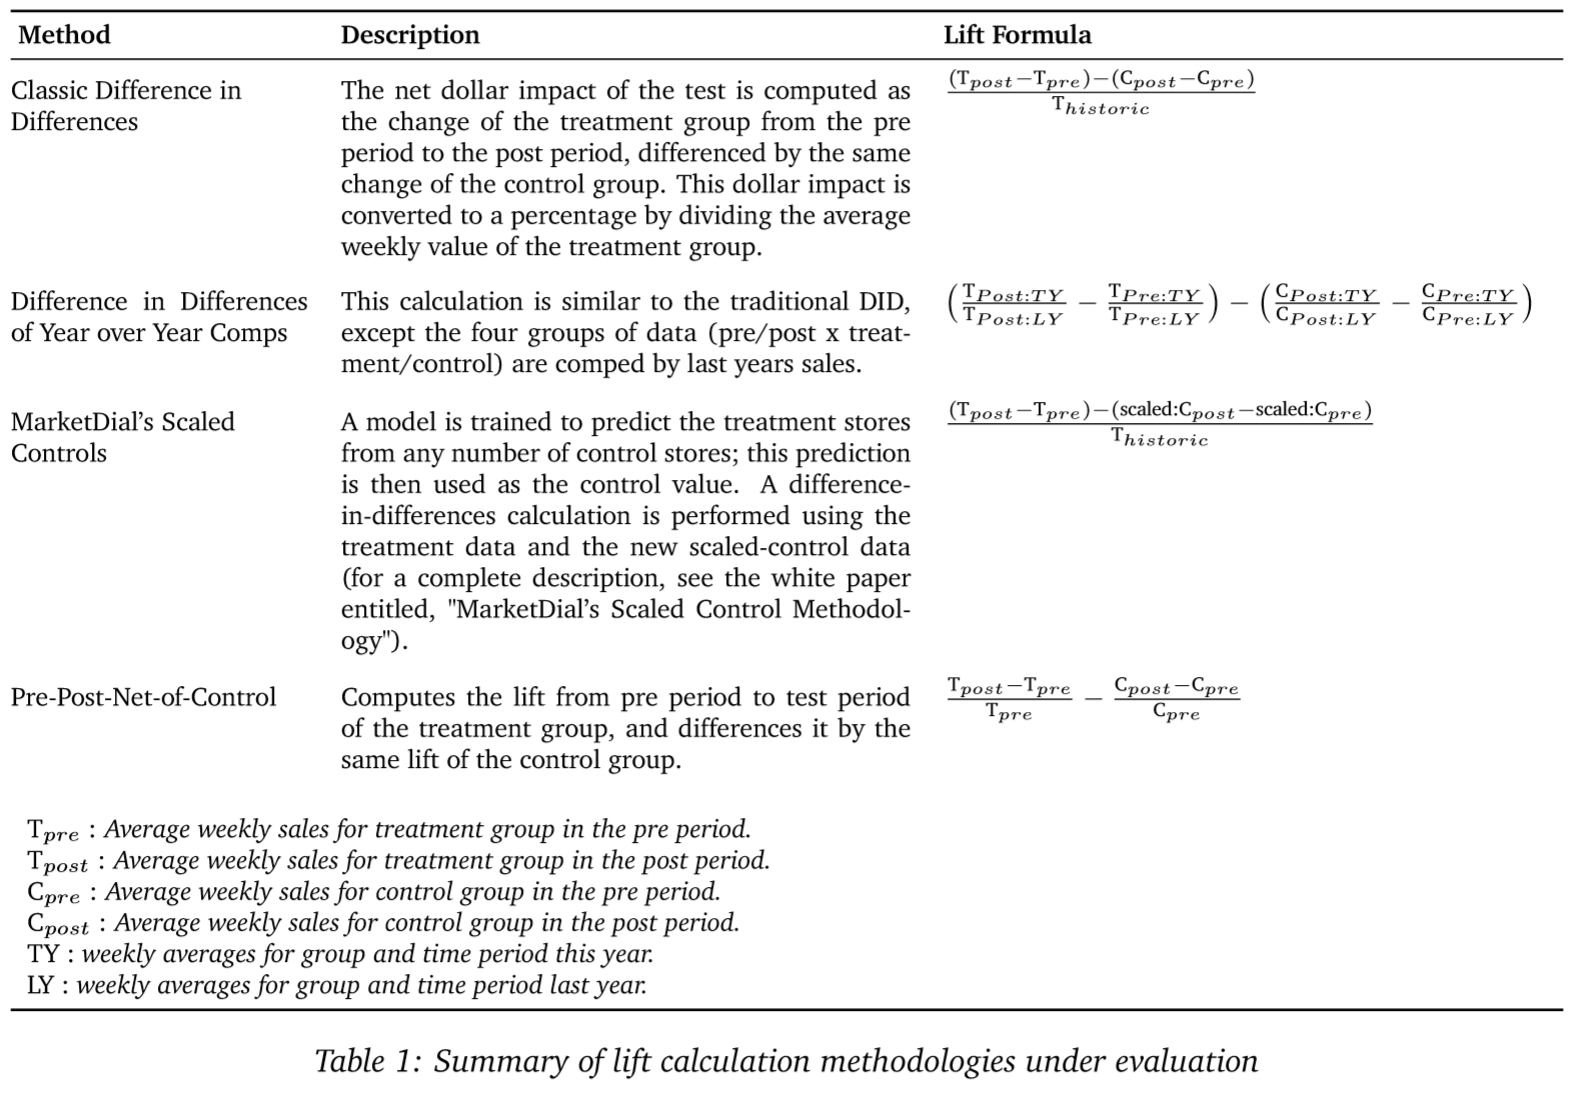
In our series of experiments we vary the number of controls selected as well the method used for computing lift estimates. While our primary concern is quantifying how control-store matching effects MarketDial’s preferred lift-calculation method, for due diligence we also evaluate the effect of multiple controls on other lift-calculation methods we’ve commonly seen employed by retailers conducting in-house testing. For each of the lift-calculation methods listed in Table 1 below, we try using a 1-to-1, 1-to-3, 1-to-5, and 1-to-10 treatment-to-control-store matching procedure. Then for each control-store matching procedure, and each lift-calculation method, and a variety of sample sizes, we perform 5000 simulated tests.
For each test iteration:
- Use 3 years of historical data.
- Use 13 weeks as the pre-period.
- Use a single group of products that is representative of typical test hierarchies.
- Randomly select group of treatment stores.
- Randomly select test start-date such that pre-period duration and post-period duration fit within the historical data.
- Select control stores using MarketDial control-store selection method.
- Analyze lift results using the selected lift-calculation method.
1.3 Simulation outputs
Each simulated test produces one lift calculation. Thus, for each method, each control-matching procedure, and each sample size, we get 5000 simulated lift calculations that should be clustered around 0. We can visually compare the spread of two different lift calculation methodologies by plotting histograms of their calculated lifts like that shown in Figure 1.
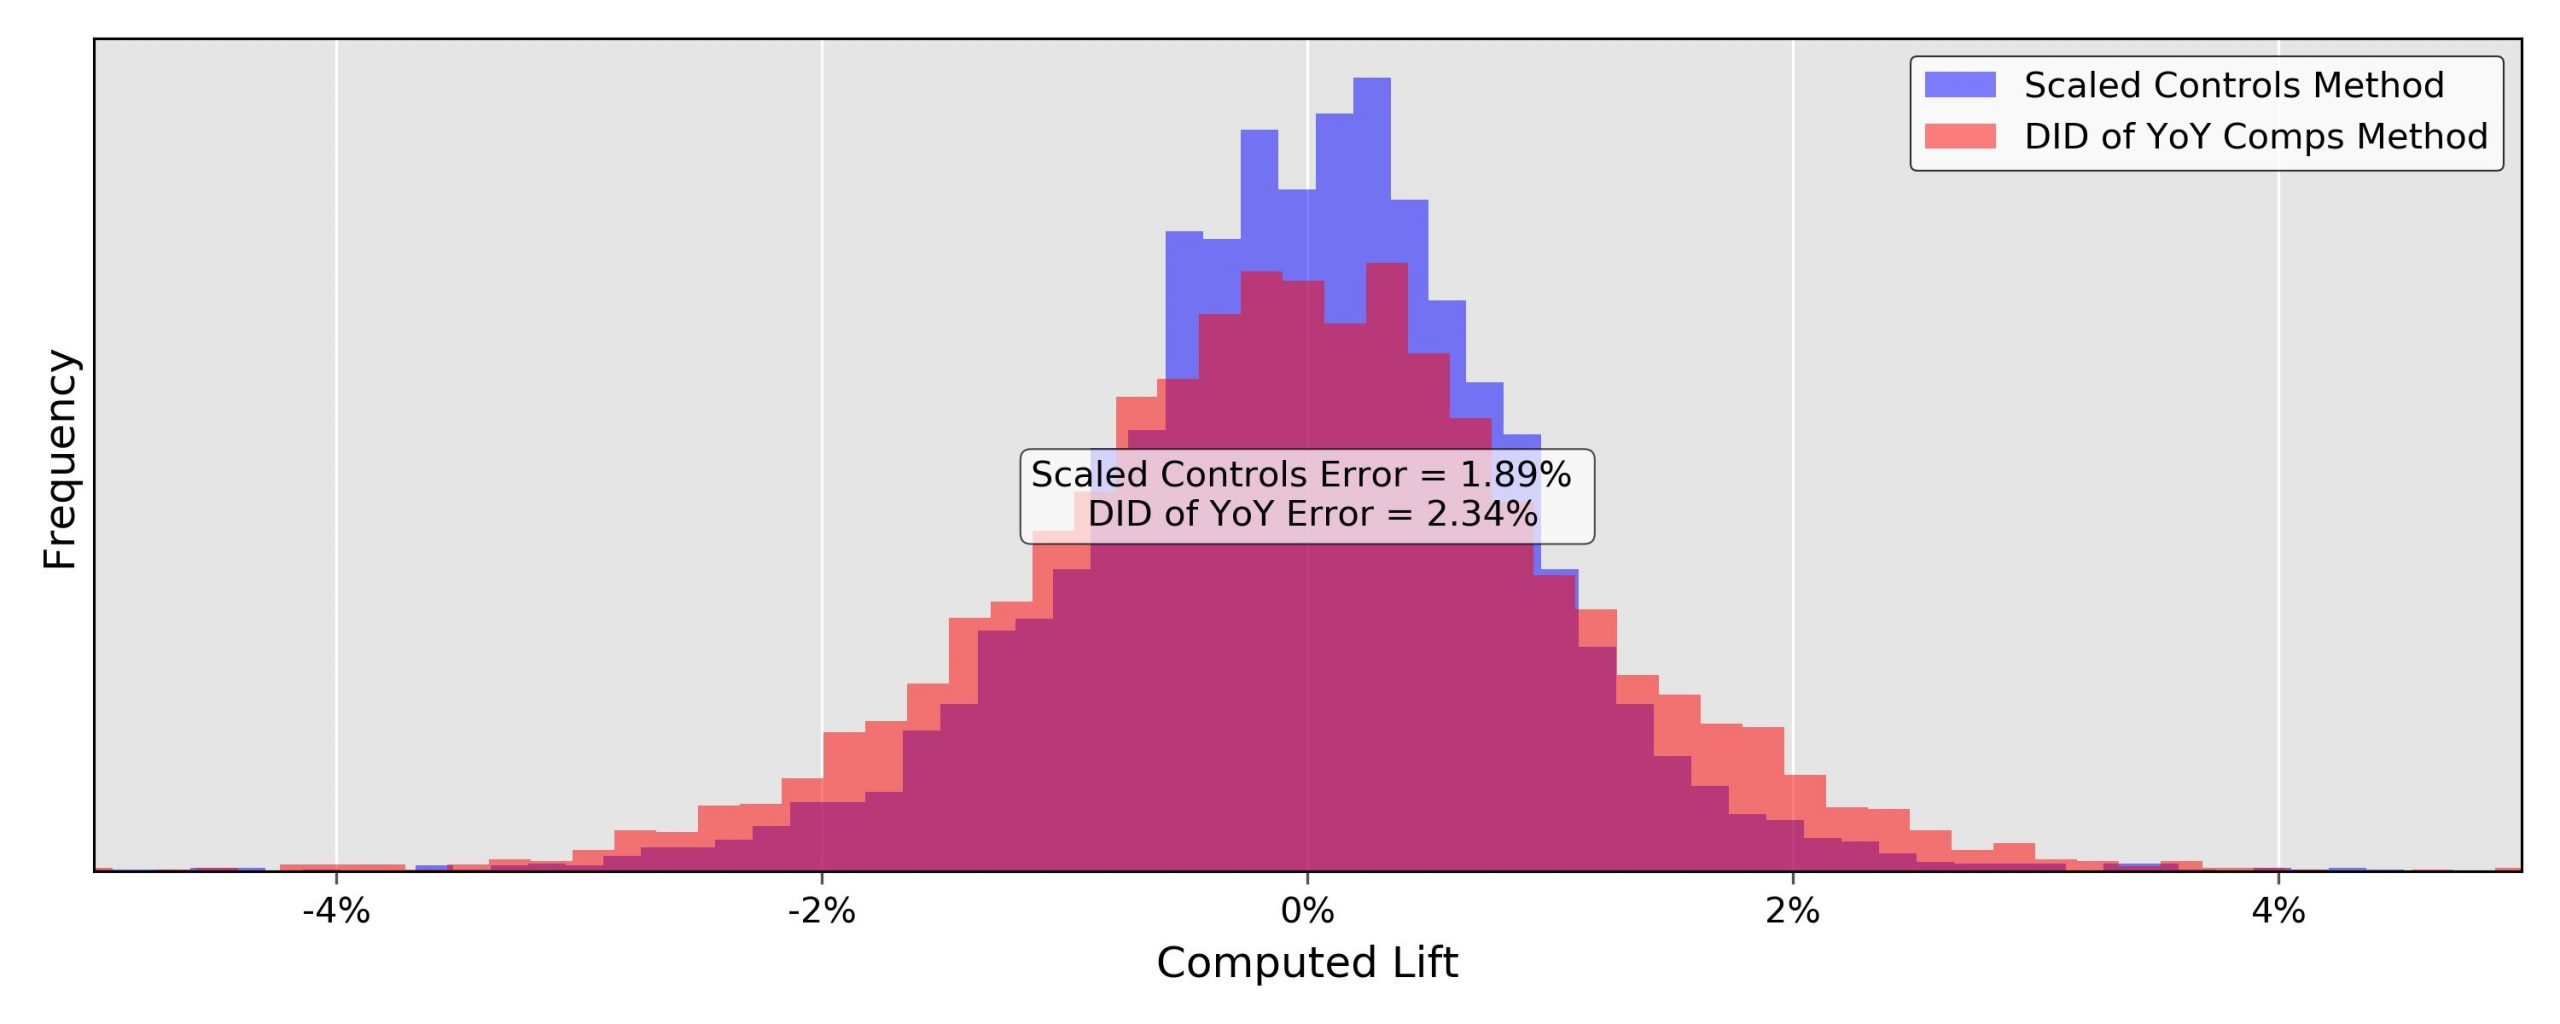
Figure 1: Histogram comparison of lift calculation accuracy for MarketDial’s scaled control methodology, and the DID of YoY comps methodology. Computed using 5000 simulations with a sample size of 20 stores and 4 weeks, and a 1-to-1 control matching procedure.
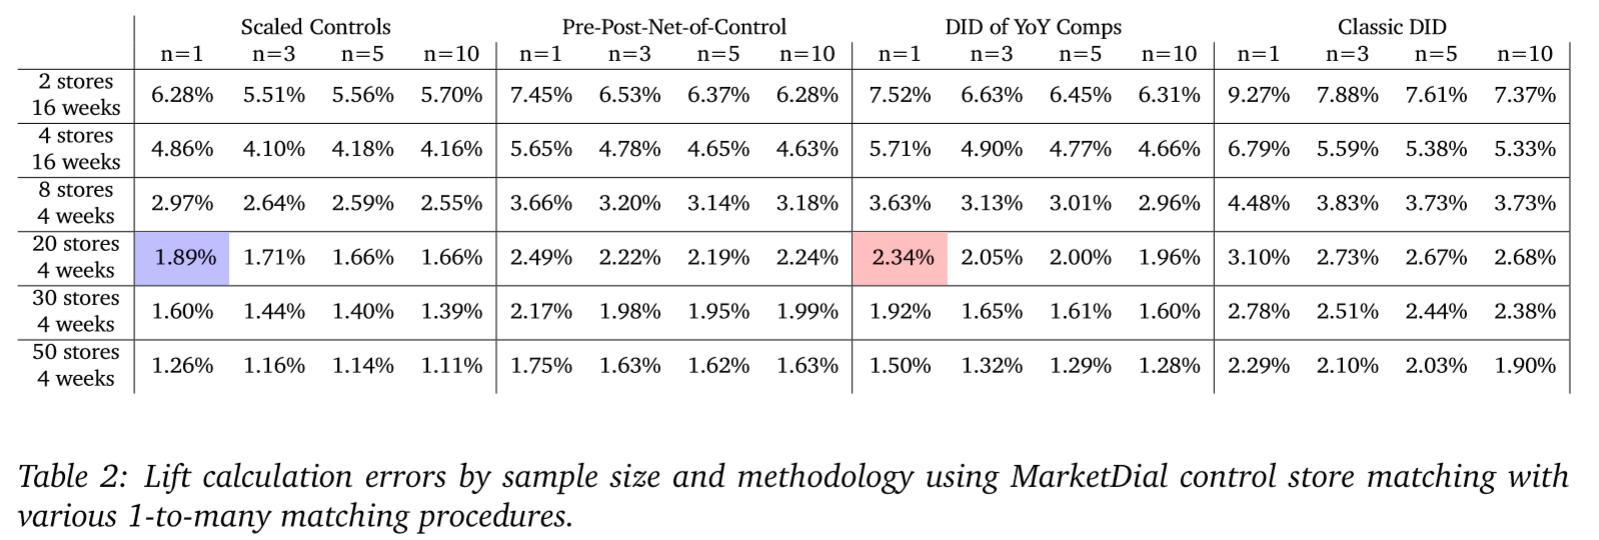
We can also summarize the histograms by their two-sigma errors or variances (the width of their spread around 0). Doing this, we see that for a sample size of 20 stores and 4 weeks, the Scaled Control’s method has roughly 20% less noise than the DID of YoY comps method. The error rates for all methods, control-sampling procedures (1-to-n), and sample sizes are illustrated in Table 2 below, with those from Figure 1 highlighted (in purple and red).
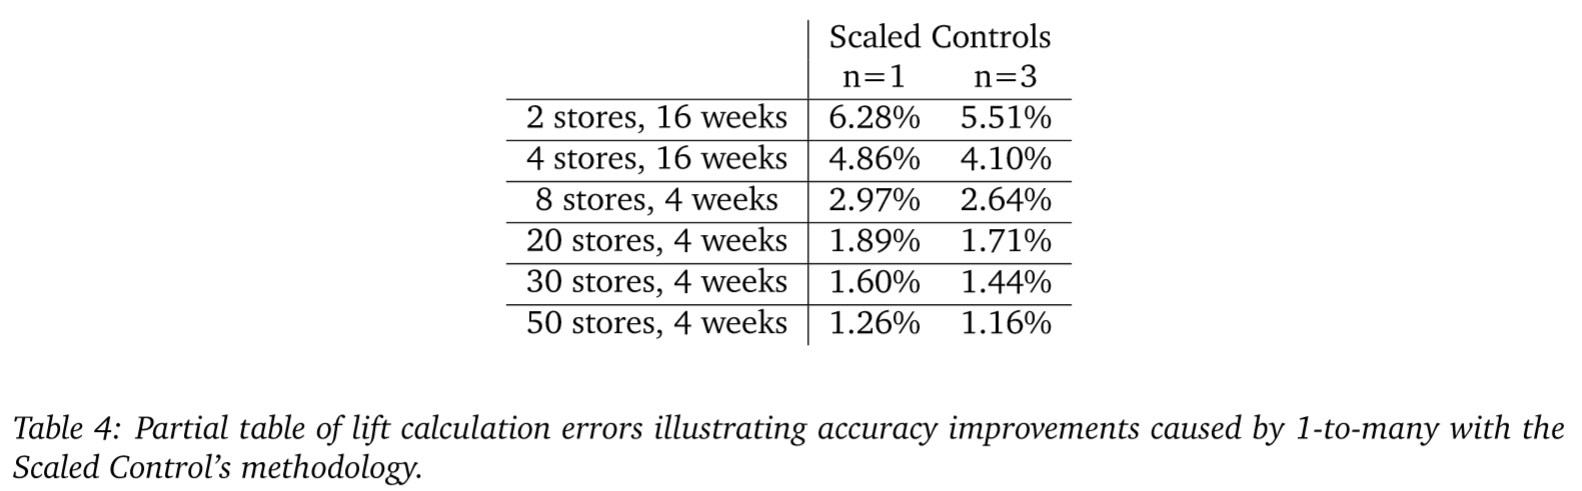
The reason we care about these error rates, is that they represent our minimal observable effect. For instance, if we were to run a test on the category of products used in this simulation using 2 stores tested over a period of 16 weeks, with the Scaled Control’s methodology our initiative would have to drive an increase of roughly 6% sales for us to be confident in the results. If we were to use the classic DID methodology, we would need to drive sales up by 9% to be confident. Any observed lift less than these values and a retailer would risk implementing an initiative that does not produce the desired outcome and only produced positive results in a limited sample by chance. If we can effectively remove noise in our lift calculations, we can increase our ability to observe subtle changes in sales patterns.
2. Results
2.1 Key takeaways on accuracy
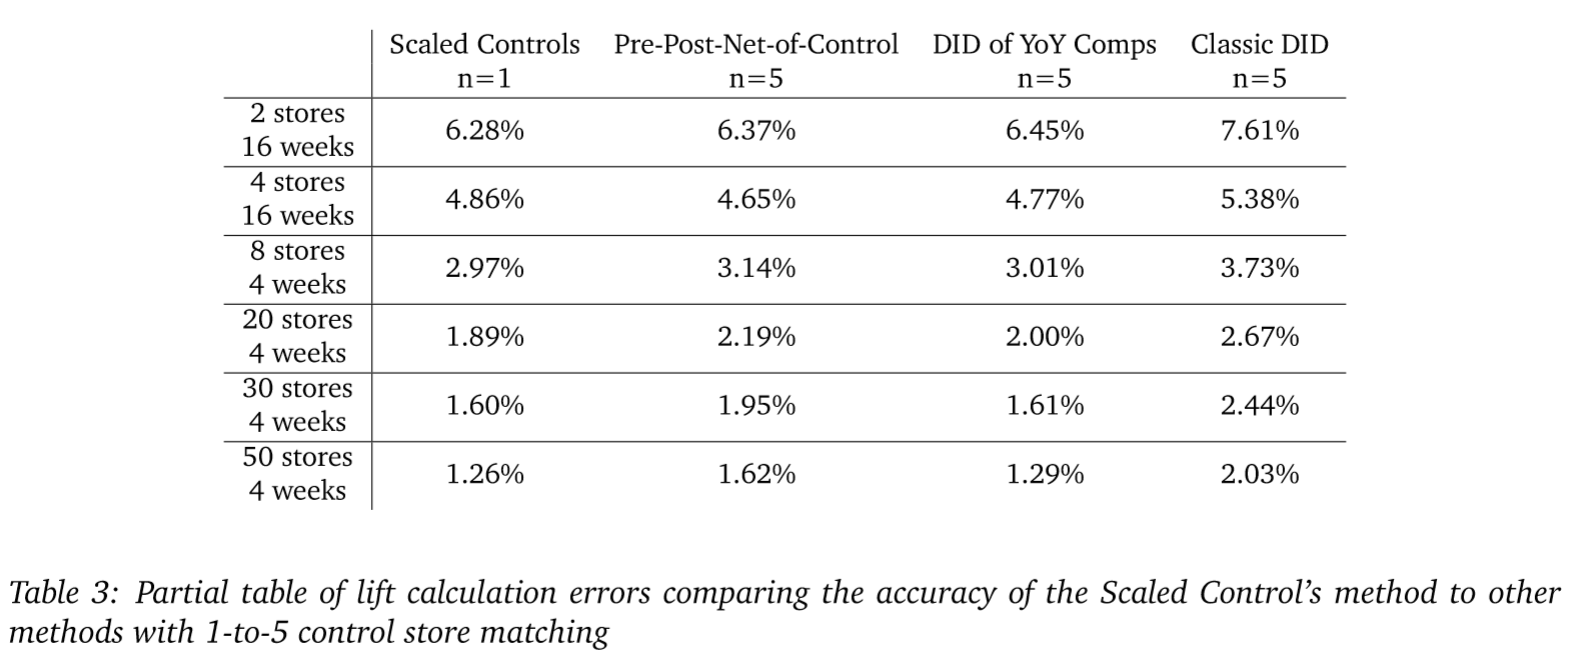
From Table 2 we see that regardless of the method used, increasing the number of controls yields moderate improvements to accuracy with diminishing returns as the number of controls gets large. However, if we compare MarketDial’s scaled control methodology with a 1-to-1 control matching procedure against the best control matching procedure for each other method, the MarketDial methodology is generally more accurate across sample sizes even with a single control.
If we employ MarketDial’s scaled-control methodology, we see a roughly 10% decrease in noise across sample sizes by using a 1-to-3 matching procedure as opposed to 1-to-1. In many cases, using more than 5 control stores per treatment store actually results in reduced accuracy as the noise from additional control stores outweighs the unique information gathered. Although there are moderate improvements from using 1-tomany matching methods, these methods do not overcome the practical limitations of employing 1-to-many matching such as increased cost of experimentation and, because more stores are being used in experiments, decreased ability to run frequent experiments.
2.2 Impact of 1-to-many control matches on testing frequency
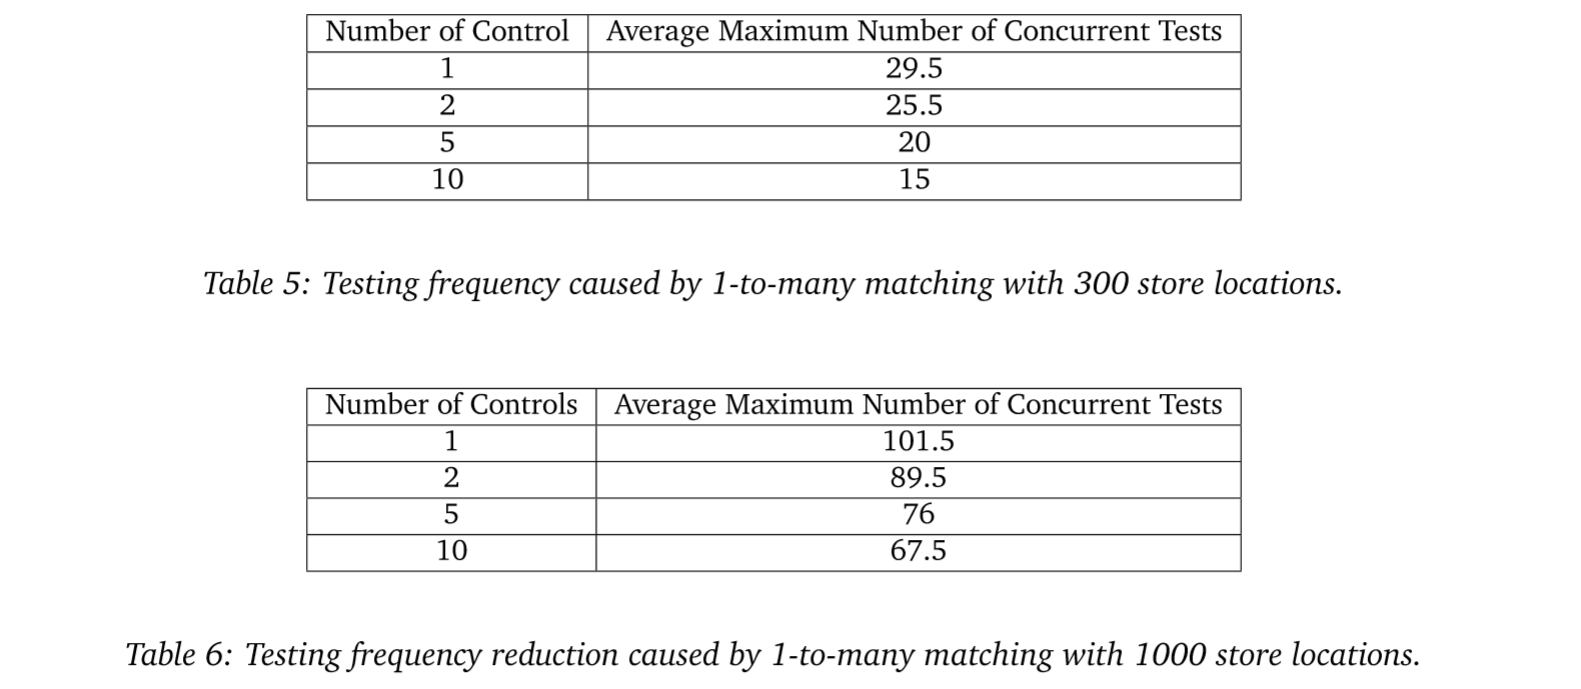
To see the impact on testing frequency, we simulate MarketDial’s treatment-and-control selection algorithm for successive tests until we exhaust available stores for future tests. Table 5 shows the testing frequency reduction by using a 1-to-many matching strategy. The parameters used for Table 5 are 300 store locations, 13 weeks of pre-period, 4 weeks of implementation, 8 weeks of test duration, 13 weeks of burn-down, and 10 treatment stores per test over the course of 1 year. Table 5 assumes control stores can be selected as long as they are not used as treatment stores in other tests, meaning control stores can be reused as control stores in additional tests. Table 6 provides another example, keeping all parameters the same as Table 5 except with 1000 store locations rather than 300 store locations. When using 1-to-many control-store matching, we lock up stores faster which leads to reduced testing frequency. Additionally, the reduced number of candidate stores available for successive tests to choose as treatment and control stores negatively impacts test quality.
2.3 Impact of 1-to-many control matches on test quality
The quality of a test can generally be described by two distinct measures, representativeness and comparability. Representativeness describes how well the selected treatment stores represent the total population; high-quality representativeness implies that the learning from a test can be generalized to a retailer’s total fleet. Comparability describes how well the control stores’ sales trends track those of the treatment stores; good comparability allows us to remove seasonal effects and isolate the contributions of the initiative under assessment. MarketDial measures representativeness by stratifying each individual retailer’s store fleet across store demographic data (median age, per capita income, etc), and then evaluating the proportional sampling of treatment stores from these strata. Comparability is measured by a combination of matching demographic data and the correlation of historic sales patterns between the treatment and control stores.
Naturally, as successive tests are built, both the representativeness and comparability of future tests are decreased as optimal candidate stores are being used in other experiments. However, 1-to-many control-store matching increases the rate at which representativeness and comparability drop. Using a 200 store retailer, in general we see that when using a 1-to-5 matching procedure, by the 9th consecutive test built representativeness falls from 100% to below 50%. This drop in representativeness does not occur until roughly the 14th consecutive test for 1-to-1 control matches. Similarly for comparability, when using a 1-to-5 matching procedure we see a drop to 85% comparability by the 10th consecutive test, and for 1-to-1 matching this does not happen until the 17th consecutive test. Thus, if we were to try to preserve test quality, using a 1-to-5 matching procedure we would need to test 30% less than when using a 1-to-1 matching procedure.
3. Conclusion
This paper investigated the effect of multiple control-store matches on test accuracy and testing frequency. We conducted a rigorous series of experiments comparing 16 different matching strategies and lift-calculation methods across a number of different test sample sizes. We found that 1-to-many matching results in moderately, but not substantially, more accurate lift estimates. Additionally, we found that MarketDial’s scaled control methodology with a single control, has greater accuracy than all the other methods we evaluated regardless of the number of controls those alternative methods use.
We also compared the number of tests that can be conducted across all stores over the period of one year. We found that 1-to-many matching (switching from 1 to 2, 2 to 5, or 5 to 10) results in at least a 10% decrease and at most a 25% decrease in the number of tests that can be conducted per year. Additionally, using multiple control matches reduces sample representativeness by as much as 50% and control comparability by as much as 20%. This is a significant decline in potential testing and test quality due to using multiple control stores. We recommend Scaled Control 1-to-1 matching as the best method to maximize return on investment in store marketing campaigns, promotions, pricing tests, new product tests, or other initiatives. Scaled control matching is more accurate than other methodologies, and 1-to-1 allows for substantially more tests to be conducted per year with minimal effect on accuracy.
References
- Kirk, R. E. (2007). Experimental design. The Blackwell Encyclopedia of Sociology.
- White, H., & Sabarwal, S. (2014). Quasi-experimental design and methods. Methodological Briefs: Impact Evaluation, 8, 1-16.
- Gu, X. S., & Rosenbaum, P. R. (1993). Comparison of multivariate matching methods: Structures, distances, and algorithms. Journal of Computational and Graphical Statistics, 2(4), 405-420.
To learn more, schedule a demo, or receive a six-month proof of concept, please contact us at [email protected] or call us at 855.867.4669 and check out these resources:
The power of precision: Mastering control selections for in-store testing
The test and learn dynamic duo: Retail regression analysis + A/B testing